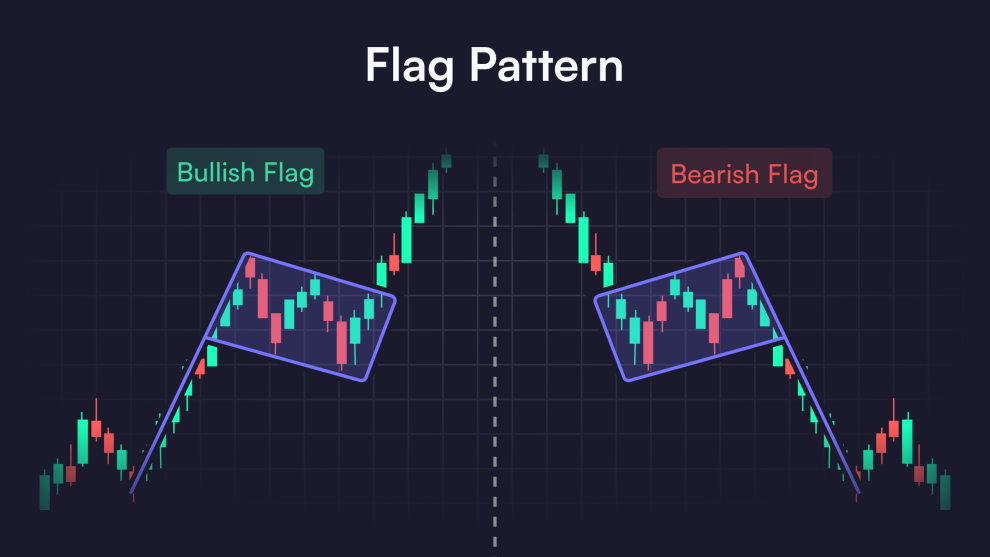
Understanding Bitcoin’s price movements can be challenging for investors. How can traders effectively identify whether the market is bullish or bearish? The answer lies in chart analysis, which helps traders make informed choices based on past price patterns. Mastering these techniques can significantly enhance your trading strategy.
When performing Bitcoin chart analysis, it’s essential to recognize critical indicators like price trends, candlestick patterns, and momentum signals. These elements provide insight into market behavior and help determine whether Bitcoin is heading for a rally (bullish) or a decline (bearish). Let’s explore how to identify these trends.
Recognizing Bullish Trends
One key sign of a bullish market is the formation of an upward-sloping price channel. This channel typically consists of price movements that consistently climb higher over time. Traders should look for patterns in which each successive peak and trough is greater than the last.
In addition, they are often accompanied by increasing trading volume. As more investors enter the market, demand drives prices higher. Watching for these volume spikes helps confirm the validity of a bullish one.
Spotting Bearish Trends
Bearish, by contrast, occurs when prices form a downward-sloping channel. In this case, each peak and trough is lower than the one before it, signaling a decline in market confidence. Traders should pay close attention to these lower highs and lower lows to determine when to sell or avoid entering a position.
Falling trading volume also accompanies them, as fewer buyers are interested in the asset. Monitoring volume is essential for confirming whether a bearish is likely to continue or reverse.
Using Moving Averages to Identify Trends
Moving averages are a standard tool in chart analysis. They smooth out price data and help traders identify trends more clearly. A simple moving average (SMA) or exponential moving average (EMA) can help traders spot bullish and bearish trends.
For bullish, Bitcoin’s price will often remain above the moving average, while bearish is indicated when the price steadily stays below the moving average. Crossovers between short-term and long-term stirring averages can also signal potential trend reversals.
Candlestick Patterns as Indicators
Candlestick patterns are another valuable tool for identifying Bitcoin trends. A bullish engulfing pattern, for example, occurs when a large green candle fully engulfs the previous red candle, indicating a potential bullish reversal. Similarly, a bearish engulfing pattern shows a large red candle overtaking a smaller green one, signaling a bearish reversal.
Other candlestick patterns, like the hammer and hanging man, can help traders spot upcoming trends. These patterns provide visual cues about market sentiment and potential price movements.
Momentum Indicators for Confirmation
Momentum indicators, like the Relative Strength Index or the Moving Average Convergence Divergence, offer additional confirmation of trends. An RSI above 70 suggests an overbought market, indicating a potential bearish reversal, while an RSI below 30 signals oversold conditions, pointing to a possible bullish move.
MACD crossovers can also confirm strength. A bullish crossover appears when the MACD line intersects above the signal line, while a bearish crossover happens when the line drops below the signal line.
Recognizing bullish and bearish trends in Bitcoin chart analysis is essential for making enlightened trading decisions. As with any market, patience and practice are crucial to mastering these techniques and confidently rising and falling trends. By consistently applying these strategies, traders can improve their ability to anticipate market shifts.


